Nike - Equity Research

Introduction & Methodology
This report aims to provide a detailed methodology and reasoning for the valuation of Nike Inc. Firstly, we will discuss the various metrics that were considered and their significance in the valuation process. This will give readers an understanding of the factors that were considered in order to arrive at our final valuation. Next, we will delve into the actual numbers used in our calculations. We will provide a breakdown of the data and assumptions made, as well as the various model and methods employed in the valuation process. This will give readers a clearer understanding of the valuation process and the level of detail in the analysis. Finally, we will present our valuation and recommendation based on the analysis conducted. This will include a detailed discussion of the assumptions made. Our recommendation will be based on the strength of the company’s fundamentals, the industry outlook, and other relevant factors.
Overall, this report provides a detailed analysis of Nike Inc. and its valuation, with a focus on transparency and clarity in our methodology and reasoning. To begin we define several key elements of our analysis and their importance.
The first of which is the Weighted Average Cost of Capital (WACC) which is a fundamental financial measure that determines the average cost of financing a company’s operations and projects. It is computed by taking the proportionate weights based on the capital structure of the firm. The debt and equity capital structure is calculated by dividing the total debt or total equity by the enterprise value of the firm. These weights are then multiplied by their respective costs, and the resulting figures are summed up. Lastly, the cost of debt is adjusted by deducting the tax savings from the interest expense, which gives the effective cost of debt. The resulting figure is the WACC, which serves as an essential benchmark for evaluating the potential profitability of investment opportunities.
The higher the WACC, the higher the cost of capital, and consequently, the riskier the investment. Therefore, understanding, and computing WACC is critical in assessing the feasibility of projects and making informed investment decisions.
As stated previously the Weighted Average Cost of Capital (WACC) is a crucial financial metric that determines the average cost of raising capital for a company’s projects and operations. Essentially, it provides a gauge of the minimum return that a project must yield to meet the organization’s cost of capital. As such, the WACC acts as a threshold or discount rate, depending on the context and usage. Internally, companies utilize WACC as a hurdle rate to determine the feasibility of a project before approving it. Externally, investors view a firm’s WACC as a discount rate, which helps them assess the viability of an investment opportunity. By using WACC as a discount rate, investors can determine the net present value of future cash flows generated by a particular investment and determine the fair value of the company. Additionally, WACC also factors in the risk associated with a project or investment, as the cost of capital may vary based on the level of risk involved. Therefore, a higher WACC indicates greater risk and a correspondingly higher cost of capital, making it an essential consideration for any financial analysis.
The estimation of the cost of equity is a critical step in computing the Weighted Average Cost of Capital (WACC). Two commonly used methods for estimating the cost of equity are the Capital Asset Pricing Model (CAPM) and the Dividend Discount Model (DDM). Although each has its own strengths and weaknesses, combining the two can provide the most accurate estimate of the cost of equity.
CAPM is advantageous because it considers the risk of the firm relative to the market, which can be useful in determining the appropriate expected return on an investment. However, there are some caveats with this method. One is that the analyst must make assumptions about the market rate of return, which can be difficult to estimate with precision. Additionally, the beta must be calculated over a period that may be arbitrarily chosen, which can lead to variability in the results.
A benefit of the DDM as a valuation approach is that it considers future dividends as the primary source of returns for an investor. However, there are limitations to this method as well. Such as not all companies issue dividends thus the cost of equity cannot be calculated using his model. And like CAPM analysts must make assumptions in this case they must estimate future dividend growth, which can be challenging and prone to errors. Moreover, unlike CAPM, the DDM does not account for market risk.
By using both methods in conjunction, the strengths of each can be leveraged to offset the weaknesses of the other. This approach can provide a more robust and accurate estimate of the cost of equity, which ultimately leads to a more reliable estimate of WACC. It is important to note that these methods are not foolproof and rely on certain assumptions, which may have an impact on the final results. Therefore, analysts must exercise care and diligence when using these methods to arrive at their final estimates.
Cost of Equity

WACC

Model Assumptions
As previously mentioned, using both the Capital Asset Pricing Model (CAPM) and the Dividend Discount Model (DDM) in conjunction can provide a more robust and accurate estimate of a company’s cost of equity. This is because the strengths of each model can be leveraged to offset the weaknesses of the other. By using this approach, a more reliable estimation of the Weighted Average Cost of Capital (WACC) can be obtained. In the case of Nike’s cost of equity calculation, we took the average of the two models. Several assumptions were made for each model. For the CAPM, we chose the 1-year Treasury note rate as the risk-free rate. This rate was selected because it strikes a balance between short-term fluctuations and long-term stability. Additionally, investors tend to hold their investments for more than a year to avoid capital gains. For the beta assumption, we used a 3-year average, which smoothed out any recent fluctuations while remaining sensitive to Nike’s current beta. Finally, we assumed a market risk premium of 5.9%, which is calculated as the historical market return minus the risk-free rate. In the case of the DDM, fewer assumptions were made, but the model does not account for risk as the CAPM does. For our calculation, we assumed a terminal value growth rate of 3%. This conservative estimate was chosen to combat the high level of uncertainty associated with future cash flow estimation.
All together the two models are averaged together resulting in the approximate cost-of-equity for Nike Inc of 7.87% and a WACC of 7.54% compared to the previous analyst estimations of 12%. This new estimate is signifiacntly lower than previously measured. With all else being equal (cost-of-debt, capital structure) the following section will demonstrate the that even marginal moves in the cost-of-equity and WACC can inversely affect the market value of the company.
Discounted Cash Flows
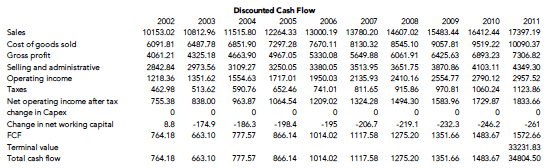
To value Nike Inc, future cash flows were projected ten years into the future, and a conservative terminal value of 3% was selected to represent perpetual growth thereafter. The sum of all future cash flows was discounted back to present value using the Weighted Average Cost of Capital (WACC). The analysis revealed that a decrease in the WACC of 4.46% (12% - 7.54%) had a significant impact, resulting in equity value creation of over 12 billion dollars. In other words, the price per share of Nike Inc stock doubled from $42.09 at a 12% discount rate to $84.71 at a 7.54% discount rate. If the new discount rate is to be accepted this suggests that the company is undervalued and could present a compelling opportunity for investors seeking long-term growth prospects.

Recommendation
This report reflects on Nike’s business in the early 2000s, and with the benefit of hindsight, it may seem evident that Nike stock was an excellent long-term investment or even undervalued at the time. However, it is important to note that our recommendation does not consider factors such as Nike’s current market cap, which is roughly 17 times its market cap in 2002. It is also essential to acknowledge that this analysis is not comprehensive and solely relies on the discounted cash flow model for the recommendation, without considering other models or relevant qualitative data such as corporate strategy, market outlook, and brand image.
Based on our estimated cost of equity and subsequent weighted average cost of capital, we recommend that at Nike’s current share price of $42.09 the stock is selling at a significant discount relative to its cost of capital and has a large upside potential of reaching its true value of $84.71. However, this recommendation assumes that our estimated cost of equity and WACC is closer to Nike’s true cost of capital and that there are no insurmountable short term risks or factors that would compromise Nike’s current or future business.