Cigna - Equity Research
Cigna Group - Investor Research
Business Overview
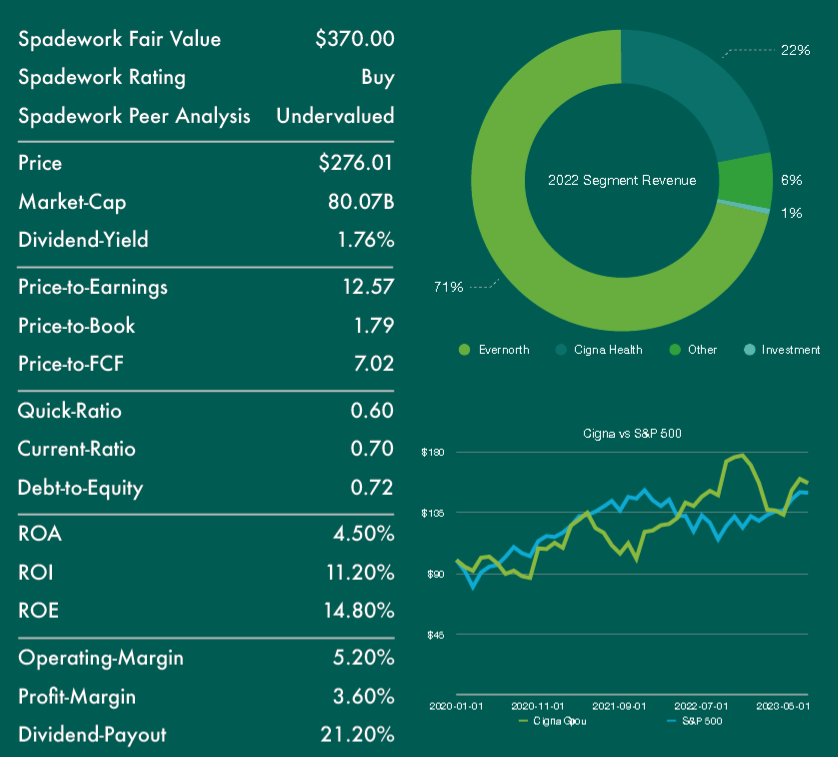
Cigna Group is a global company focused on health and wellness, with a presence in nearly 30 countries and a workforce of over 70,000 employees. The company operates through three main business units: Evernorth, a leading provider of healthcare and pharmacy solutions; Cigna Healthcare, one of the largest health insurers in the United States; and Other Operations, which encompasses business segments not aligned with the company’s strategic vision. This includes recent divestitures such as Cigna’s life insurance, accident, and supplemental benefits operations. In Q2 of 2023, Cigna reported earnings of $6.13 per share, just slightly exceeding our estimates by 2%. The full-year guidance remains robust, with expected cash flow from operations to exceed $9.5 billion, marking a 9% increase from the previous year.
The stock has consistently traded at a significant discount compared to its peers across various metrics. This is largely attributed to the under performance of certain business segments, which have negatively impacted the company’s earnings. However, recent divestitures are anticipated to reduce working capital requirements relative to earnings. Moreover, there is an anticipated increase in synergies between Cigna Healthcare and Evernorth, with an estimated $15 billion of additional synergy driven revenue projected over the next decade.
The Company’s transformation into healthcare insurance and pharmacy solutions began more than 5 years ago through its merger with Express Scripts. While sales have been growing at an average annual rate of 5%, in line with its competitors, it has yet to make a significant impact with investors. Currently, the company’s valuation remains at a 35% discount-to-earnings compared to its peers. However, over the long term, Cigna is strategically positioning itself as a leader in healthcare and healthcare services, which will result in streamlined operations. Improvements on the bottom line will be driven from Return on Assets (ROA) and Return on Investment (ROI) which are expected as the company’s pharmacy solutions business gains additional market share. While merger activity would be beneficial to shareholders, this is highly unlikely as regulators have already denied previous merger attempts. Investors should not speculate or rely on a future merger as a means of purchasing the stock but, rather bet on more acquisition activity as the company attempts to firm up it’s market share.
Management has also articulated its intention to distribute an additional $8 billion in dividends over the next 4 years, in addition we estimate projected share repurchases of $10 billion. Together CI is expected to payout $9 per share annually or an equivalent dividend yield of 3.5%-4% by 2026, based on today’s stock price.
Peer Valuation Analysis
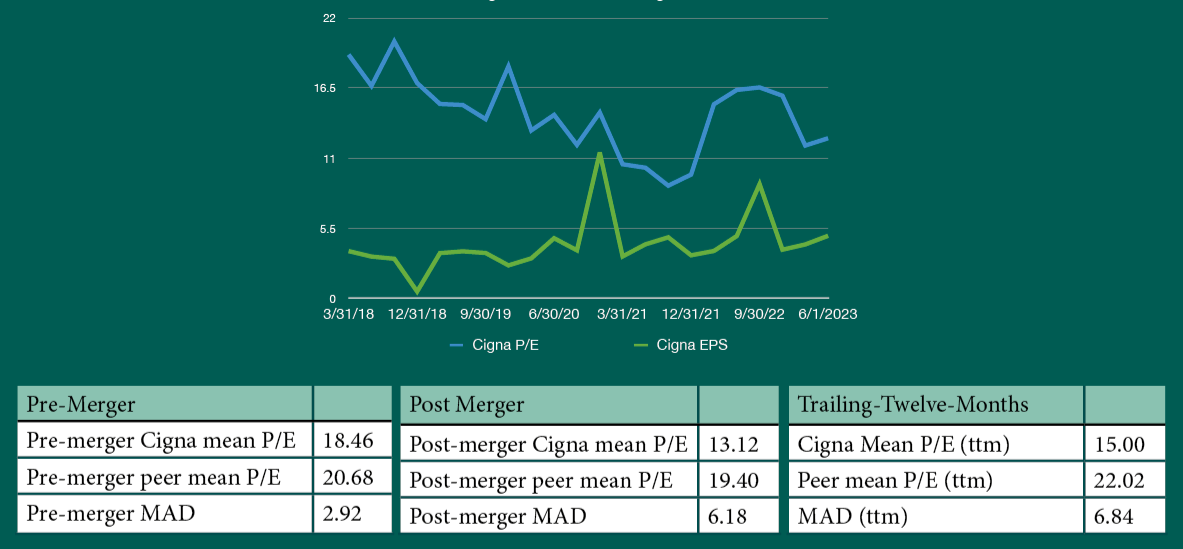
Cigna’s historical P/E ratio relative to peers
Overview
Historically Cigna has traded at a discount relative to its peers in recent years that trend has intensified with Cigna currently trading 7x below earnings relative to its peers. The presence of this “discount” or more precisely the deviation from its peer’s price multiples does not itself represent a market mispricing or indicate that in the future Cigna’s price multiples will or should match that of its peer’s. However, given that the company’s financial performance and future growth is in-line and in some cases exceeding its peers, we believe it is an appropriate time for investors to question whether the stock’s current valuation is accurate.
This analysis will focus primarily on Cigna’s valuation relative to its peers. First, let’s examine the underlying reasons for the existing valuation disparity and associated business risks. Next, we will explore recent trends in the valuation, followed by a comprehensive assessment of the long-term valuation of Cigna in relation to its industry peers. The primary valuation ratio used in the analysis will be the Price-to-Earnings (P/E) ratio, given its extensive utilization within the investors and its simplicity; however, it’s important to note that similar trends are observable across other price multiples as well (e.g., Price-to-Book, Price-to-Sales).
Business Risks & Uncertainties
The acquisition of Express Scripts has allowed the company to offer in-house medications and pharmacy services to their healthcare subscribers, all while reducing costs. This strategic move mirrors a trend that several competitors have adopted to maintain a competitive edge, namely UnitedHealth, Humana & CVS with the acquisition of Aetna. The pharmacy-benefits-management (PBM) business model operates on the premise that PBM’s, large customer base of insurance companies, governments, and businesses, wield significant negotiation leverage with drug manufacturers. This leverage in theory allows PBMs to offer lower prices on drugs and pharmaceutical.
However, this business model has faced challenges recently, partly due to newcomers like Mark Cuban’s Cost-Plus Drugs, which promises prescription drugs at cost plus a 10% markup. Furthermore, Cigna has undergone government scrutiny for allegedly excessive drug markups. Amazon has also begun to disrupt the industry with its highly competitive pharmacy solutions, extending Prime members free delivery, along with substantial discounts of 80% on generic and 40% on name-brand drugs and prescriptions.
Cigna stands as a major player in the PBM industry, serving a vast network of over 100 million Americans. Despite the continued profitability of the PBM industry, Cigna confronts significant pressure from both competitors and regulators. As of today, this risk has not resulted in any noticeable decline in growth or margins. Nonetheless, it’s apparent that the industry faces increased competition. Because of this, investors and Cigna shareholders should remain attentive to the evolving landscape of Cigna’s business.
After the merger, it is evident that Cigna has transformed into a markedly different company with its Evernorth unit (formerly Express Scripts), which contributed to approximately 60% of earnings in 2022. While the stock has shown an upward trend since the merger, its valuation has lagged its peers, even though its financial performance has been on par with, and in some cases, superior to its rivals such as Humana & Elevance. The risk for investors of Cigna is the possibility that they have placed all their chips in a highly competitive industry in which they may struggle to find sustainable growth and keep up with larger rivals and disrupters like UnitedHealth Group & Amazon. At present this risk has not materialized into reduced earnings and there is no indication that it will soon yet, the risk remains very real for Cigna and investors.
Data & Methodology
The collected mean and absolute distance data, reveals a significant deviation in Cigna’s current Price-to-earnings ratio compared to its peers. Additionally, the P/E ratio is near an all-time low, despite the company’s record anticipated earnings of $24.75 per share by the year’s end, marking an YoY increase of over 18%. Despite this robust financial performance, a considerable valuation disparity persists.
To assess whether Cigna’s Price-to-earnings ratio is significantly below its usual level (the mean), we could formulate a hypothesis and construct a confidence interval using Cigna’s own historical P/E data to arrive at an answer. However, there are several limitations to this approach. Firstly, it doesn’t account for systemic market risks i.e. market wide movements like selloffs or bubbles that can distort the past & present P/E ratio. While this issue can be resolved with a sufficiently large dataset, introducing more data can skew the test due to the opposite reason – the addition of large amounts of historical data could cause a smoothing effect, whereby current or more recent data samples are underweighted relative to the large amount of historical data.
To address these issues, we conduct a hypothesis test using the mean absolute distance statistics (MAD) of Cigna’s P/E ratio from the P/E ratios of its peers. In lieu of utilizing a benchmark like the S&P-500, we have chosen to use the average P/E ratio of Cigna’s peers. We make this decision because Cigna’s beta is 0.63, whereas the S&P500 (market beta) is theoretically 1.0. Using the S&P-500 as the benchmark might lead to an overestimation of the valuation disparity or MAD statistics.
By using the average P/E ratio of Cigna’s peers, which include Humana, UnitedHealth, and Elevance, to calculate absolute distance statistics, we adopt a more reliable approach to that accounts for systematic risk (market-wide risks) that can influence price multiples across the industry. But more importantly this method highlights instances where company-specific (unsystematic) risks cause Cigna’s P/E ratio to deviate from that of its peers.
H0: Cigna’s P/E ratio relative to its peers is within its pre (post) merger normal range.
Ha: Cigna’s P/E ratio relative to its peers is NOT within its pre (post) merger normal range.
H0: |Cigna’s P/E ratio - Mean P/E ratio of peers| ≤ Mean-Absolute-Difference
Ha: |Cigna’s P/E ratio - Mean P/E ratio of peers| > Mean-Absolute-Difference
During the pre-merger period (2015-2018), Cigna’s average P/E ratio was 18.46x, closely aligned with the peer average of 20.70x. However, after the merger, a noticeable deviation starts to emerge. While the preceding peer 3-year average P/E remains steady at 19.40x, Cigna’s average P/E falls significantly to 12.52x. Although proving a direct causal relationship between these two factors is challenging, the timing and extent of this decline suggest that the merger has not positively influenced investor sentiment regarding Cigna’s valuation.
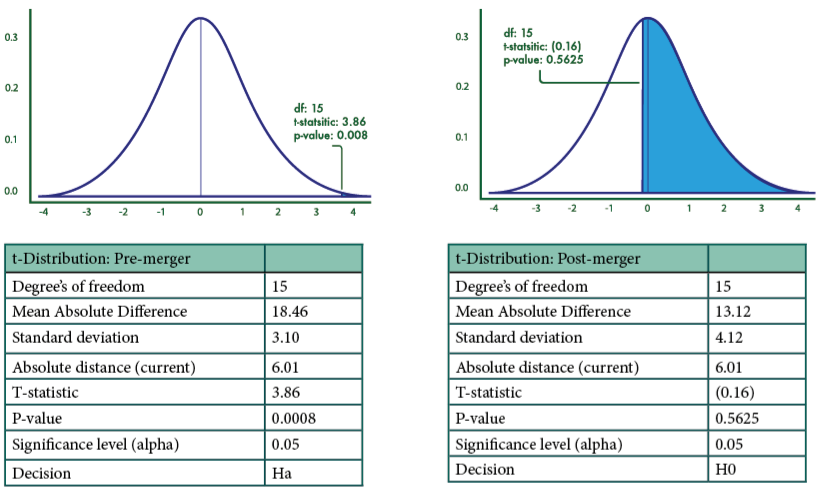
To assess whether the stock’s valuation is outside the normal range, we have formulated two t-distribution tests. The first test employs data from the pre-merger period, while the second test utilizes data from the past 4 years (post-merger). The primary objective of the first test is to determine whether the current P/E ratio relative to the peer average falls outside the pre-merger normal range. In contrast, the second test employs data from the most recent 16 quarters to determine if the current P/E ratio deviates from the post-merger normal range. Again, both tests use Cigna’s relative valuation i.e., the difference between Cigna’s P/E ratio and the peer average to test for extreme values outside what would be expected.
Peer Valuation Summary
Conducting pre- and post-merger tests illustrates two distinct valuations for the Cigna Group. After analyzing the results of the pre-merger test, it becomes evident that the stock is significantly undervalued in relation to peer firms, as indicated by a p-value of 0.0008. The outcome of the second test suggest that the stock’s valuation relative to peers is well within the expected range of values, with a p-value of 0.5625. This test essentially serves as a confirmation that investors have devalued the stock due to apprehensions that the merged entity would lag behind its competitors in the healthcare and PBM (Pharmacy Benefit Management) sector. Both Cigna’s financial performance and its comparison with peers contradict this assumption, revealing a more positive narrative.
Once again given the robustness of Cigna’s financial performance and the compelling results obtained from the pre-merger hypothesis test, there is strong evidence that Cigna is substantially undervalued. Based on this analysis and with a 95% confidence interval, the appropriate price is 16.34x earnings for a fair value price of 358.59 per share.
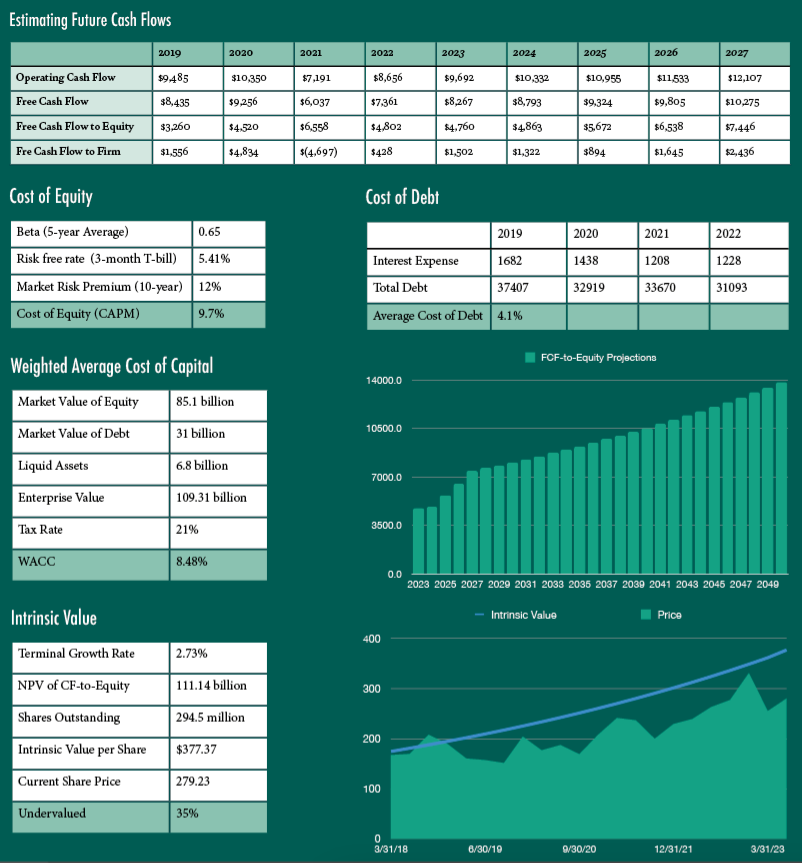
Discounted Cash Flow Analysis
Our estimation of intrinsic value is built on a discounted cash flow model. An overview of the model and its assumptions is described below. For a better understanding of the principals behind the discounted cash flow model <click here>.
Final Note
The evidence presented in this report strongly supports the conclusion that Cigna Group is indeed undervalued at present. This claim is substantiated by the outcomes of the hypothesis tests, which indicate undervaluation both in terms of historical context and in comparison to peer companies. Additionally, results from the Discounted Cash Flow (DCF) model reinforce this perspective, indicating a substantial disparity between the intrinsic value of Cigna Group and its current market price.
Combining the outcomes of both analyses, a fair value range emerges, spanning from $358.58 to $377.37 per share. Within this range, we can confidently estimate the true worth of Cigna Group. As a result of this comprehensive assessment, our projection for Cigna Group’s performance over the next twelve months culminates in a target price of $370.00 per share. This target price assumes the contiunuation of strong financial performance and a macro-economic enviroment where rates begin to stabilize and peak and inflation pressures normalize.